South Florida Market Snapshot – May 2026
Data source: realtor.com.
Monthly data updated on June 3, 2026 with data through May 2026.
Miami-Dade County
- Median Listing Price: $592,450 (−3% YOY / 0% MOM)
- Active Listings: 17,024 (−12% YOY / −1% MOM)
- Median Days on Market: 86 (−1% YOY / +4% MOM)
- New Listings: 3,392 (−3% YOY / −2% MOM)
- Price Increases: 182 (−11% YOY / −24% MOM)
- Price Reductions: 2,938 (−31% YOY / −10% MOM)
- Pending Listings: 3,653 (+12% YOY / −4% MOM)
- Median Price per Square Foot: $461 (−3% YOY / −1% MOM)
Broward County
- Median Listing Price: $381,950 (−5% YOY / +1% MOM)
- Active Listings: 14,870 (−16% YOY / −2% MOM)
- Median Days on Market: 82 (−1% YOY / +2% MOM)
- New Listings: 3,440 (+1% YOY / +2% MOM)
- Price Increases: 136 (−9% YOY / −17% MOM)
- Price Reductions: 3,608 (−27% YOY / +2% MOM)
- Pending Listings: 3,661 (+11% YOY / −2% MOM)
- Median Price per Square Foot: $304 (−3% YOY / +1% MOM)
Palm Beach County
- Median Listing Price: $496,200 (−1% YOY / −1% MOM)
- Active Listings: 11,072 (−21% YOY / −5% MOM)
- Median Days on Market: 77 (−4% YOY / +3% MOM)
- New Listings: 2,884 (−2% YOY / −3% MOM)
- Price Increases: 100 (−26% YOY / −29% MOM)
- Price Reductions: 2,784 (−34% YOY / −16% MOM)
- Pending Listings: 3,673 (+18% YOY / −5% MOM)
- Median Price per Square Foot: $306 (0% YOY / −1% MOM)
Behind the Numbers
The latest data across Miami-Dade, Broward, and Palm Beach continues to reflect a market moving at a measured pace. Median listing prices remain relatively stable, with modest year over year declines across the region. Active inventory continues to trend below last year's levels, while pending listings remain solidly above last year in all three counties, indicating that buyers are continuing to transact despite fewer available listings. Median days on market have also improved compared to a year ago, suggesting a slightly more efficient pace for well-positioned properties.
Additional Insight
One of the more notable shifts this month is the continued decline in price reductions across all three counties, even as inventory remains below last year's levels. Fewer sellers appear to be making significant pricing adjustments, while pending activity continues to outpace last year's performance. This combination suggests a market where buyers remain active and sellers are becoming more aligned with current market conditions from the outset. Rather than signaling a faster market, the data points to one that continues to reward realistic pricing and thoughtful positioning.
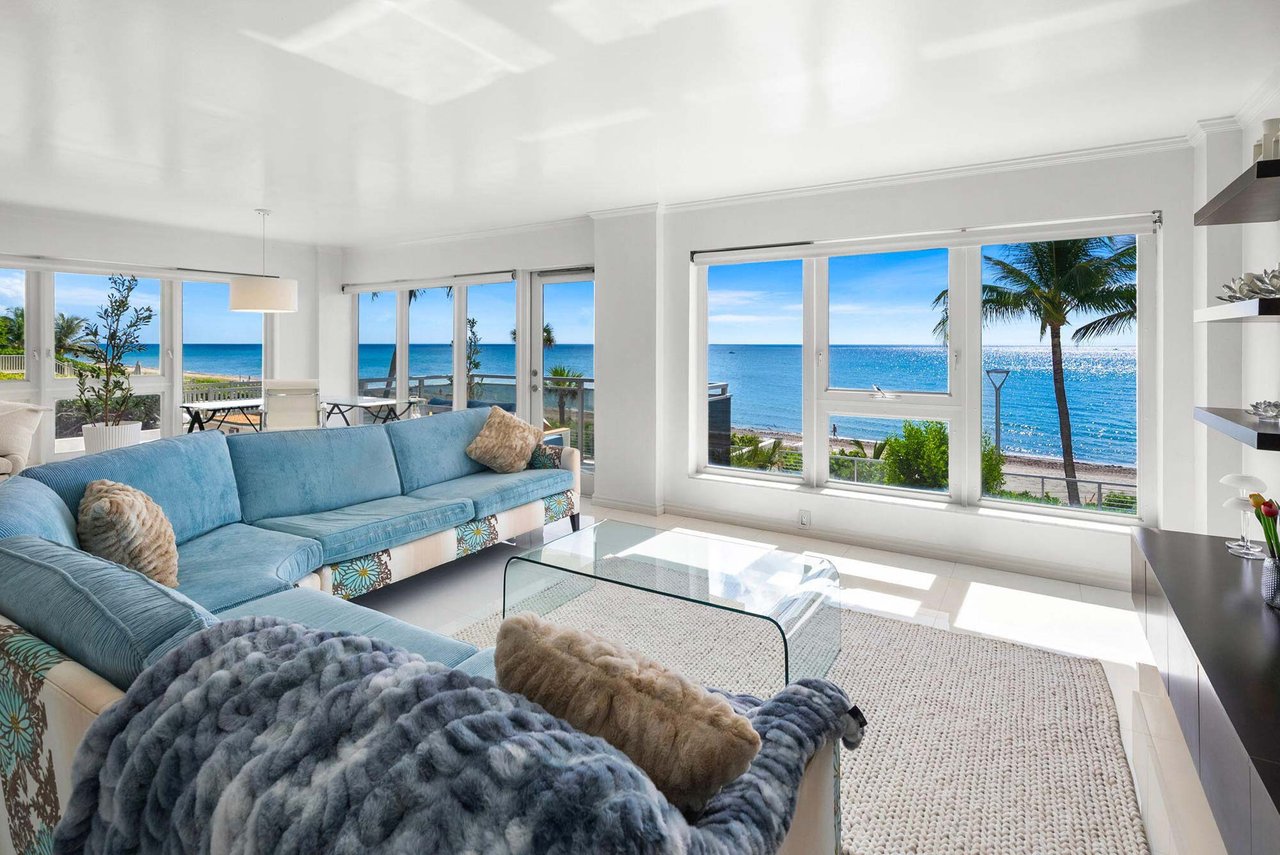
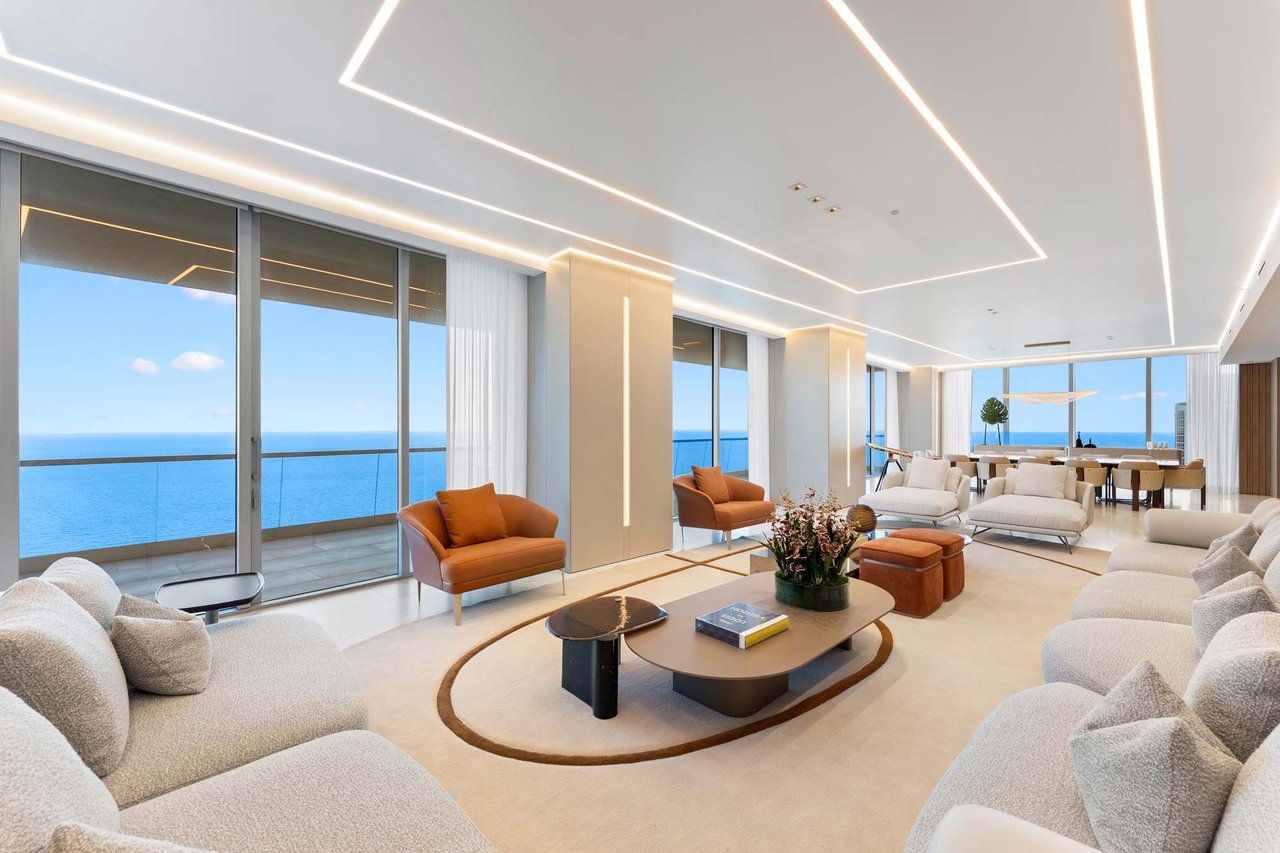
Header image courtesy of Jordan Lederman. 18501 Collins Avenue, 4003-04, Sunny Isles Beach, FL. View property here.
Market data is sourced from third-party providers and reflects information available at the time of publication. Figures are subject to revision, errors, and omissions.