South Florida Market Snapshot – February 2026
Data source: realtor.com.
Monthly data updated on March 5, 2026 with data through February 2026.
Miami-Dade County
- Median Listing Price: $599,450 (−4% YOY / 0% MOM)
- Active Listings: 18,215 (+2% YOY / 0% MOM)
- Median Days on Market: 89 (+13% YOY / −5% MOM)
- New Listings: 4,052 (−10% YOY / +3% MOM)
- Price Increases: 192 (−9% YOY / −8% MOM)
- Price Reductions: 3,418 (−16% YOY / +1% MOM)
- Pending Listings: 3,484 (+13% YOY / +24% MOM)
- Median Price per Square Foot: $468 (−5% YOY / −1% MOM)
Broward County
- Median Listing Price: $388,641 (−3% YOY / −2% MOM)
- Active Listings: 16,086 (−3% YOY / +2% MOM)
- Median Days on Market: 82 (+14% YOY / −6% MOM)
- New Listings: 3,742 (−12% YOY / −7% MOM)
- Price Increases: 160 (+7% YOY / −2% MOM)
- Price Reductions: 4,024 (−24% YOY / +4% MOM)
- Pending Listings: 3,312 (+4% YOY / +22% MOM)
- Median Price per Square Foot: $305 (−4% YOY / 0% MOM)
Palm Beach County
- Median Listing Price: $500,000 (−1% YOY / 0% MOM)
- Active Listings: 12,818 (−10% YOY / +3% MOM)
- Median Days on Market: 76 (+4% YOY / −5% MOM)
- New Listings: 3,564 (−13% YOY / −4% MOM)
- Price Increases: 134 (+20% YOY / −9% MOM)
- Price Reductions: 3,958 (−27% YOY / +1% MOM)
- Pending Listings: 3,500 (+13% YOY / +34% MOM)
- Median Price per Square Foot: $311 (−1% YOY / 0% MOM)
Behind the Numbers
February data across Miami-Dade, Broward, and Palm Beach continues to reflect a market operating at a more deliberate pace. Median listing prices remain slightly below last year across all three counties, while inventory shows mixed movement, with Miami-Dade holding near prior levels and Broward and Palm Beach trending lower year over year. Days on market remain elevated across the region, indicating longer decision timelines. At the same time, pending activity has increased in key areas, reinforcing that properties priced appropriately and well-positioned are continuing to move despite a more selective environment.
Additional Insight
A notable dynamic this month is the continued rise in pending listings alongside a more controlled flow of new inventory. This suggests that while supply is not expanding aggressively, buyer activity remains present and focused. With fewer new listings entering compared to earlier in the year, absorption appears more aligned with available inventory. This environment supports a steadier pace of transactions, where preparation, pricing, and presentation play a more defining role in outcomes than timing alone.
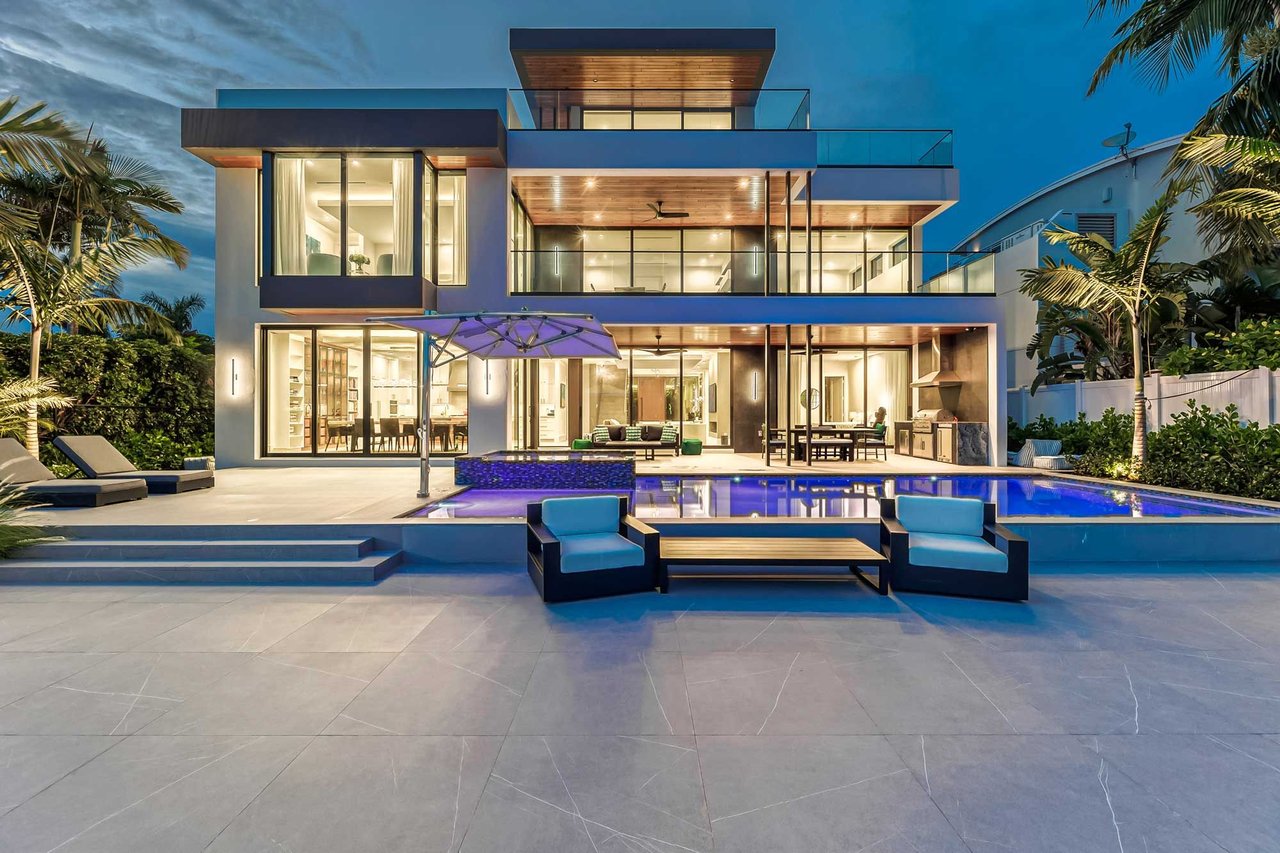
Header image courtesy of Tyler Tuchow. 1730 SE 13th Street, Fort Lauderdale, FL. View property here.
Market data is sourced from third-party providers and reflects information available at the time of publication. Figures are subject to revision, errors, and omissions.